Shopsy online shopping

Browse Categories
- Furniture


Furniture
Furniture is an integral part of our daily lives, providing comfort, functionality, and aesthetic appeal to our living spaces. From ancient civilizations to modern times, the evolution of furniture has been a fascinating journey. This comprehensive guide aims to delve into the world of furniture, exploring its history, types, materials, and the latest trends.
The Historical Evolution of Furniture
Ancient Furniture: From Early Civilizations to the Middle Ages
- Overview of furniture in ancient Mesopotamia, Egypt, Greece, and Rome
- The craftsmanship of medieval furniture and its influence on design
Renaissance and Baroque Periods: The Birth of Artistic Furniture
- Intricate details and ornate designs of Renaissance furniture
- Baroque influence on furniture during the 17th century
The Industrial Revolution: Mass Production and Innovation
- Impact of the Industrial Revolution on furniture manufacturing
- Introduction of new materials and styles during the 19th century
Types of Furniture
Residential Furniture: Enhancing Home Comfort
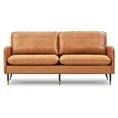
- Living room furniture: sofas, chairs, coffee tables
- Bedroom furniture: beds, dressers, nightstands
- Dining room furniture: tables, chairs, buffets
Office Furniture: Ergonomics and Productivity
- Desks, chairs, and storage solutions for the modern workplace
- Trends in home office furniture with the rise of remote work
Outdoor Furniture: Bridging the Gap Between Indoors and Outdoors
- Patio sets, outdoor sofas, and dining furniture
- Weather-resistant materials and maintenance tips
Specialized Furniture: From Antique to Modern
- Antique furniture: collectors' items and historical value
- Custom and bespoke furniture for unique preferences
Materials Used in Furniture Construction
Wood: A Timeless Favorite
- The durability and versatility of different wood types
- Sustainable and eco-friendly wood sourcing practices
Metal: Modern and Industrial Aesthetics
- Steel, aluminum, and other metal alloys in furniture design
- Contemporary trends in metal furniture
Upholstery and Fabrics: Adding Comfort and Style
- Importance of fabric selection in upholstery
- Trends in color, texture, and patterns for fabric-covered furniture
Synthetic Materials: Durability and Affordability
- Plastic, laminate, and composite materials in furniture
- Pros and cons of synthetic materials in furniture construction
Design Trends in Modern Furniture
Minimalism: Less is More
- Clean lines, simple shapes, and functional designs
- Integration of minimalism in various furniture pieces
Sustainable and Eco-Friendly Furniture
- The rise of environmentally conscious design
- Recycled materials and sustainable practices in furniture manufacturing
Smart Furniture: Embracing Technology in Design
- Integration of technology in furniture for convenience
- Examples of smart furniture and their functionalities
Mix and Match: Eclectic Design Approaches
- Blending different styles, colors, and materials for a unique look
- Tips for achieving a cohesive eclectic design in furniture
Conclusion: As we traverse through the rich history, diverse types, and evolving trends in the world of furniture, it becomes evident that furniture is more than just functional pieces—it is a reflection of our culture, lifestyle, and design preferences. Whether it's the timeless appeal of wooden classics or the futuristic designs of smart furniture, the world of furniture continues to captivate and inspire us, shaping the way we experience and interact with our living spaces.
- Cooking
Cooking
Cooking is an art that transcends the boundaries of culture, geography, and time. It is a universal language that speaks to our senses, connecting us through the joy of flavors and the satisfaction of a well-prepared meal. In this comprehensive exploration, we will delve into the diverse facets of cooking, from its historical roots to the modern culinary landscape. Join us on a gastronomic journey as we uncover the secrets, techniques, and cultural significance of cooking.
The Historical Tapestry of Cooking
Early Culinary Practices
The history of cooking dates back to ancient times when humans discovered fire and began experimenting with different methods of preparing food. Explore the evolution of cooking techniques, from roasting over an open flame to the development of rudimentary cookware.
Culinary Traditions Around the World
Every culture has its unique culinary traditions that reflect its history, geography, and available ingredients. Uncover the fascinating stories behind iconic dishes from various regions, showcasing the diversity of cooking methods and flavor profiles.
The Science of Cooking
The Chemistry of Flavor
Delve into the molecular world of cooking and understand how chemical reactions transform raw ingredients into a symphony of flavors. Learn about the Maillard reaction, caramelization, and other processes that contribute to the complexity of taste.
The Role of Heat in Cooking
Heat is a fundamental element in cooking, influencing the texture, color, and taste of ingredients. Explore the different heat transfer methods used in cooking, from conduction to convection, and discover how chefs master the art of temperature control.
Culinary Techniques
Knife Skills: The Foundation of Every Chef
A sharp knife is a chef's best friend. Uncover the importance of knife skills in the culinary world, from basic cutting techniques to advanced precision cuts. Learn how to choose the right knife for each task and maintain its sharpness.
Essential Cooking Methods
Whether it's sautéing, braising, or sous-vide, each cooking method imparts a distinct character to the dish. Explore the essential cooking techniques that form the backbone of culinary mastery, with practical tips for perfecting each method.
The Art of Flavor Pairing
Understanding Flavor Profiles
Unlock the secrets of flavor by dissecting the components that make up a dish. From sweet and savory to umami and bitter, explore the nuances of flavor profiles and how chefs balance them to create a well-rounded culinary experience.
Pairing Ingredients: A Symphony of Tastes
Discover the art of ingredient pairing and how chefs combine diverse elements to elevate their dishes. From classic combinations to avant-garde pairings, explore the creative process behind crafting harmonious flavor marriages.
Cultural Influences on Cooking
Fusion Cuisine: Where Tradition Meets Innovation
As the world becomes more interconnected, culinary traditions blend in unexpected ways. Explore the phenomenon of fusion cuisine, where chefs draw inspiration from diverse cultures to create dishes that celebrate global flavors.
Rituals and Symbolism in Cooking
Food is often deeply intertwined with cultural rituals and symbolism. Delve into the significance of culinary practices in various cultures, from the symbolism of certain ingredients to the role of food in religious ceremonies.
Cooking in the Digital Age
The Rise of Food Tech
From smart kitchen appliances to virtual cooking classes, technology is transforming the way we approach cooking. Explore the innovations that are shaping the culinary landscape and how chefs leverage technology to enhance their skills.
Social Media and the Food Revolution
Instagram-worthy dishes, viral recipes, and food influencers – social media has become a powerful force in the culinary world. Examine the impact of platforms like Instagram and TikTok on food trends, aesthetics, and culinary storytelling.
Sustainable Cooking
Farm-to-Table Movement
The farm-to-table movement emphasizes the importance of sourcing local, sustainable ingredients. Learn about the benefits of supporting local farmers, reducing food miles, and the impact of this movement on both the environment and the quality of our meals.
Plant-Based Revolution
As concerns about environmental sustainability and health grow, more people are embracing plant-based diets. Explore the world of plant-based cooking, from innovative meat substitutes to creative vegetable-centric dishes.
The Future of Cooking
Culinary Trends in the 21st Century
What does the future hold for the world of cooking? Examine emerging culinary trends, from unique ingredients and cooking techniques to cultural influences that are shaping the way we eat. Predictions from culinary experts provide insight into what lies ahead.
Conclusion: In this culinary odyssey, we've embarked on a journey through the rich history, scientific intricacies, and cultural influences that define the world of cooking. Whether you're a seasoned chef or an enthusiastic home cook, the art of cooking continues to evolve, inviting us to explore new flavors, techniques, and possibilities. As we savor the diverse tapestry of global cuisine, one thing remains certain – cooking is a timeless expression of creativity and a celebration of the universal language of taste.
- Cars
Car Accessories
Car Accessories: In the dynamic world of automotive innovation, car accessories play a pivotal role in enhancing the overall driving experience. From practical add-ons that improve safety and functionality to stylish embellishments that reflect personal taste, the market for car accessories is diverse and ever-evolving.
This comprehensive article delves into the exciting realm of car accessories, exploring various categories that cater to different needs and preferences.
The Evolution of Car Accessories
Understanding the history and evolution of car accessories provides valuable insights into how these enhancements have evolved alongside the automotive industry. From humble beginnings with basic functional additions to today's cutting-edge technological advancements, car accessories have come a long way in shaping the driving experience.
Essential Accessories for Safety and Functionality
Safety on the road is paramount, and car accessories designed to enhance it have become indispensable. This section explores essential safety accessories such as airbags, anti-lock braking systems (ABS), dash cameras, and parking sensors. Additionally, we'll delve into accessories that improve functionality, including roof racks, cargo organizers, and towing kits.
Stylish Additions
Car enthusiasts often seek ways to personalize their vehicles, and this chapter explores a myriad of stylish accessories for both the interior and exterior. From custom seat covers, floor mats, and ambient lighting to exterior upgrades like alloy wheels, spoilers, and decals, discover how these accessories can transform a car into a reflection of the owner's personality.
Tech Innovations in Car Accessories
The digital age has ushered in a new era of tech-savvy car accessories. This chapter explores the latest technological innovations, including smart mirrors, GPS navigation systems, Bluetooth-enabled devices, and entertainment systems. Discover how these accessories not only make driving more enjoyable but also contribute to a connected driving experience.
Engines, Exhausts, and Suspension
For automotive enthusiasts seeking to enhance their vehicle's performance, this chapter explores accessories designed to boost horsepower, improve handling, and optimize the exhaust system. From aftermarket air intakes and performance exhausts to suspension upgrades, learn how these additions can take a car's performance to the next level.
Eco-Friendly Accessories for Sustainable Driving
As environmental concerns become more prevalent, this chapter focuses on eco-friendly car accessories. From solar-powered ventilation systems to electric vehicle charging stations and eco-friendly seat covers, discover how car owners can contribute to sustainable driving practices.
In conclusion, the world of car accessories is a vast and exciting landscape, offering something for every type of car owner. Whether prioritizing safety, style, technology, or performance, the diverse range of accessories available ensures that drivers can tailor their vehicles to meet their unique needs and preferences.
As automotive technology continues to advance, so too will the innovation in car accessories, promising an even more exciting future for car enthusiasts around the world.
- Fashion
Fashion
Fashion is not merely the clothes we wear; it's a form of self-expression, a reflection of our personality, and a mirror of the society we live in. The world of fashion is dynamic, constantly evolving, and influenced by various factors such as culture, technology, and individual tastes. This article delves into the multifaceted realm of fashion, exploring its historical roots, its impact on society, and the ever-changing landscape of trends.
The Evolution of Fashion Through History
- Ancient Influences: From ancient civilizations to the medieval era, explore how clothing has been a marker of status, occupation, and societal norms.
- Renaissance to Industrial Revolution: Witness the transition from elaborate Renaissance fashion to the functional attire of the Industrial Revolution.
Cultural Diversity in Fashion
- Traditional Attire: Discover how different cultures have preserved their identity through traditional clothing, often showcasing intricate craftsmanship and symbolism.
- Globalization and Fusion: Analyze the impact of globalization on fashion, leading to the fusion of styles from around the world.
The Power of Fashion in Society
- Social Influence: Examine how fashion shapes societal perceptions and influences social dynamics, touching upon topics like body image and self-esteem.
- Fashion as a Political Statement: Investigate instances where clothing has been used as a tool for political expression and protest.
Technology and Fashion
- Digital Revolution: Explore the role of technology in revolutionizing the fashion industry, from online shopping to virtual fashion shows.
- Sustainable Fashion: Discuss the growing importance of sustainability in fashion and how technology contributes to eco-friendly practices.
Fashion Icons and Influencers
- Iconic Figures: Celebrate legendary fashion icons who have left an indelible mark on the industry, exploring their impact on trends and style.
- The Rise of Social Media Influencers: Examine the role of social media in shaping contemporary fashion trends and the influence of online personalities.
The Business of Fashion
- Fashion Industry Dynamics: Investigate the economic aspects of the fashion industry, from design and manufacturing to marketing and retail.
- Fast Fashion vs. Sustainable Fashion: Compare the pros and cons of fast fashion and sustainable fashion, considering their environmental and ethical implications.
Trends Through the Decades
- From Flapper Dresses to Power Suits: Take a nostalgic journey through the fashion trends of different decades, exploring the cultural and societal influences that shaped each era.
- Revival of Retro Styles: Analyze the cyclical nature of fashion trends and the resurgence of vintage styles in modern times.
Fashion and Gender Identity
- Breaking Gender Norms: Discuss how fashion has played a pivotal role in challenging traditional gender norms, paving the way for inclusivity and diversity.
- Unisex and Gender-Neutral Fashion: Explore the rise of unisex and gender-neutral fashion lines, reflecting a more progressive and inclusive approach.
The Future of Fashion
- Technological Innovations: Delve into emerging technologies such as augmented reality and artificial intelligence and their potential impact on the future of fashion.
- Sustainability as a Driving Force: Discuss how the fashion industry is evolving to meet the demands for sustainable and ethical practices, shaping the future landscape.
Conclusion: Fashion is an ever-evolving tapestry that weaves together history, culture, and individual expression. As we navigate the complex world of trends and styles, it is essential to appreciate the diverse influences that contribute to the rich tapestry of the fashion industry. From its ancient roots to the digital age, fashion continues to be a powerful force that reflects, shapes, and defines our society. As we step into the future, the only certainty is that the world of fashion will continue to captivate, inspire, and evolve.
- Bags
- Kids
- Shoes
- Electronics
- Home Decor
- Clocks
-
Wall Clocks
- Big Wall Clocks
- Cool Wall Clocks
- Decorative Wall Clocks
- Digital Wall Clocks
- Glass Wall Clocks
- Wall clocks hands only
- Kitchen Wall Clocks
- Large Wall Clocks
- LED Wall Clocks
- Metal Wall Clocks
- Mirror Wall Clocks
- Modern Wall Clocks
- Pendulum Wall Clocks
- Silent Wall Clocks
- Skeleton Wall Clocks
- Small Wall Clocks
- Square Wall Clocks
- Traditional Wall Clocks
- Vintage Wall Clocks
- Wooden Wall Clocks
-
Wall Clocks
- Beauty
Dashboard Idol
Dashboard Idol: In the digital age, data reigns supreme. From corporations to individuals, we are inundated with vast amounts of information daily. With the rise of big data, the challenge lies not in obtaining data but in deciphering its meaning and extracting actionable insights. This is where data visualization comes into play, offering a visual representation of data to facilitate comprehension and decision-making.
One of the most common forms of data visualization is the dashboard. Dashboards serve as a centralized hub where various data points are displayed clearly and concisely. However, not all dashboards are created equal. As the demand for data-driven decision-making continues to grow, the evolution of dashboards – from static spreadsheets to interactive, customizable interfaces – has become increasingly evident. This evolution has given rise to what can be termed as “Dashboard Idol,” where different dashboard designs compete for supremacy in delivering meaningful insights.
Showing the single result


Lord Shiva Adiyogi Statue for Car Dashboard
Lord Shiva Adiyogi Statue for Car Dashboard: In the hustle and bustle of modern life, many individuals seek solace and spiritual connection amidst their daily commutes and travels. For devout Hindus and spiritual seekers alike, the presence of sacred symbols and deities can serve as a source of comfort and inspiration, even within the confines of their vehicles.
The Evolution of Dashboards
The journey of dashboards traces back to the early days of computing when mainframe systems generated basic reports in tabular formats. These reports evolved into static dashboards, characterized by predefined metrics and fixed layouts. While these early dashboards served their purpose, they lacked the flexibility and interactivity required to adapt to changing business needs.
With advancements in technology and the advent of the internet, dashboards transformed. The rise of web-based applications enabled the creation of dynamic dashboards capable of real-time data updates and interactive features. Users could now drill down into data, apply filters, and customize their views to focus on specific metrics or trends.
Today, the era of Business Intelligence (BI) and Data Analytics has ushered in a new wave of dashboard innovation. Modern dashboards leverage AI and machine learning algorithms to provide predictive analytics and prescriptive insights. They integrate seamlessly with disparate data sources, including cloud-based platforms and IoT devices, to offer a comprehensive view of business operations.
The Anatomy of a Dashboard Idol
What sets apart a Dashboard Idol from its counterparts? The answer lies in its design, functionality, and ability to deliver value to users. Let's explore the key attributes of a Dashboard Idol:
- User-Centric Design: A Dashboard Idol prioritizes user experience, with intuitive navigation and visually appealing layouts. It employs principles of design, such as color theory and typography, to convey information effectively. Customization options allow users to tailor the dashboard to their preferences, ensuring relevance and engagement.
- Interactivity and Accessibility: Interactivity is a hallmark of a Dashboard Idol, enabling users to interact with data in meaningful ways. Features like drag-and-drop functionality, clickable elements, and dynamic filters empower users to explore data effortlessly. Accessibility features ensure that the dashboard is usable by individuals with diverse needs, including those with disabilities.
- Real-Time Insights: In the age of instant gratification, timely insights are paramount. A Dashboard Idol leverages real-time data streams to provide up-to-the-minute information on key performance indicators (KPIs) and business metrics. Alerts and notifications alert users to critical changes or anomalies, enabling proactive decision-making.
- Scalability and Integration: As businesses grow and evolve, so too should their dashboards. A Dashboard Idol is scalable, capable of handling large volumes of data and accommodating new data sources seamlessly. Integration with third-party applications and APIs enables data consolidation and interoperability across systems.
- Predictive Analytics: Going beyond descriptive analytics, Dashboard Idol leverages predictive modeling and machine learning algorithms to forecast future trends and outcomes. Predictive analytics capabilities enable users to anticipate market shifts, identify emerging opportunities, and mitigate risks proactively.
The Impact of Dashboard Idol on Decision-Making
The adoption of Dashboard Idol has far-reaching implications for decision-making across industries. By providing stakeholders with access to timely, relevant insights, organizations can make data-driven decisions with confidence. Whether it's optimizing marketing campaigns, improving supply chain efficiency, or enhancing customer experience, the insights gleaned from Dashboard Idol empower organizations to stay ahead of the curve.
Furthermore, Dashboard Idol fosters a culture of data literacy within organizations, where employees at all levels are empowered to engage with data and derive actionable insights. From frontline staff to C-suite executives, everyone has access to the same information, fostering collaboration and alignment towards common goals.
Challenges and Considerations
Despite its many benefits, the journey towards Dashboard Idol is not without its challenges. Data privacy and security concerns must be addressed to ensure the confidentiality and integrity of sensitive information. Additionally, ensuring data quality and accuracy is paramount to avoid making decisions based on flawed or incomplete data.
Moreover, the proliferation of data silos and disparate systems presents a significant obstacle to dashboard integration and interoperability. Organizations must invest in data governance frameworks and master data management strategies to break down silos and create a single source of truth for decision-making.
The Future of Dashboard Idol
As technology continues to advance, the future of Dashboard Idol holds boundless possibilities. Augmented reality (AR) and virtual reality (VR) technologies promise to revolutionize data visualization, offering immersive experiences that transcend traditional 2D dashboards. Natural language processing (NLP) and voice-activated interfaces will enable users to interact with dashboards using simple voice commands, making data analysis more accessible than ever before.
Furthermore, the democratization of data through self-service analytics platforms will empower users to create their dashboards tailored to their specific needs, reducing reliance on IT departments and accelerating time to insights.
In conclusion, Dashboard Idol represents the pinnacle of data visualization, where design meets functionality to deliver actionable insights that drive business success. By embracing the principles of user-centric design, interactivity, and real-time analytics, organizations can harness the power of data to unlock new opportunities and stay ahead of the competition in an increasingly data-driven world.